
Flow: How To Debug A Flow And Understand Error Messages
Today I am writing on the most annoying topic ever – Debug Flow and Error Handling. I remember the first time I ever saw an error message in my life, I thought the developers must have been trying really hard to make me feel stupid (no offense developers!). Indeed, error messages can be intimidating at first. When you skim through, you will probably see a lot of capital letters and numbers and _ and (), and then you give up. However, understanding the errors is a very important and fundamental step if you want to be fluent in automation design. It is also not as hard as it seems, so I believe you can manage really quickly. Let’s get started!
We will explain this in the following order:
- Ways to debug a flow
- Structure of error messages
- Place of receiving error messages
- Customization of error messages
How To Debug A Flow
1. In Flow Builder – Debug Window
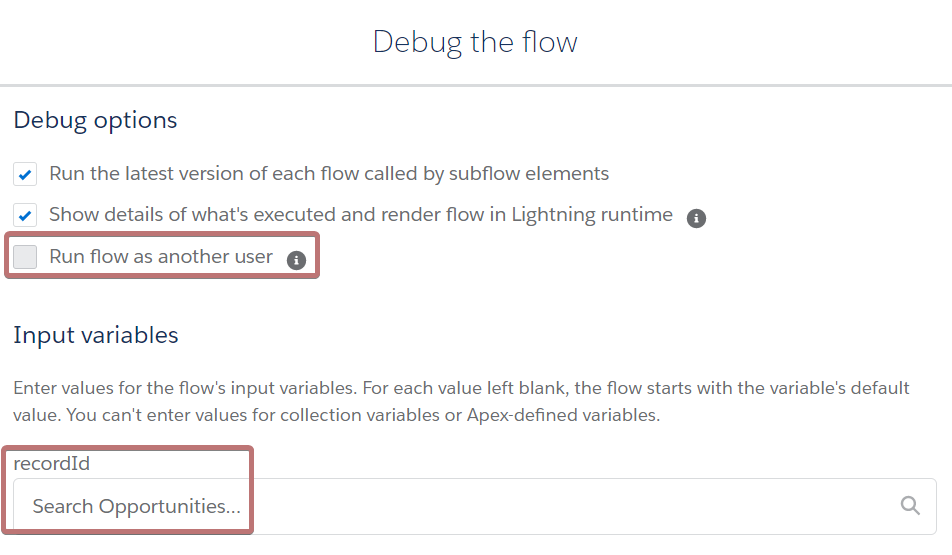
For Screen flow type, you can debug the flow in a separate window. When you click Debug on the upper right toolbar, you will see a prompt message where you can set the debug options.
- Run the latest version of each flow called by subflow elements: By default, the system will run the active version of your referenced flow (ex. subflow). If there is no active version, it will run the latest version. Check this box if you want to always run the latest version instead.
— - Show details of what’s executed and render flow in Lightning runtime: Check if you want to see all step details, uncheck if you only want to know the flow succeeds or not.
— - Run flow as another user: One issue I had with flow is that after I launch a fully tested flow, I often receive complaints from our users that it is not working for them. It is because admins have full access to the org, but not your users. Of course you can set the flow to run in the system context, but that could be risky as well. Instead, you can run the flow as another user. To enable this feature, go to Setup > Process Automation Settings > Check “Let admins debug flows as other users”
— - Input Variables: If you have any input-allowed variables, you can set them up here for testing. When you deploy the flow you have to find another way to set them up.
2. In Flow Builder – Debug On Canvas
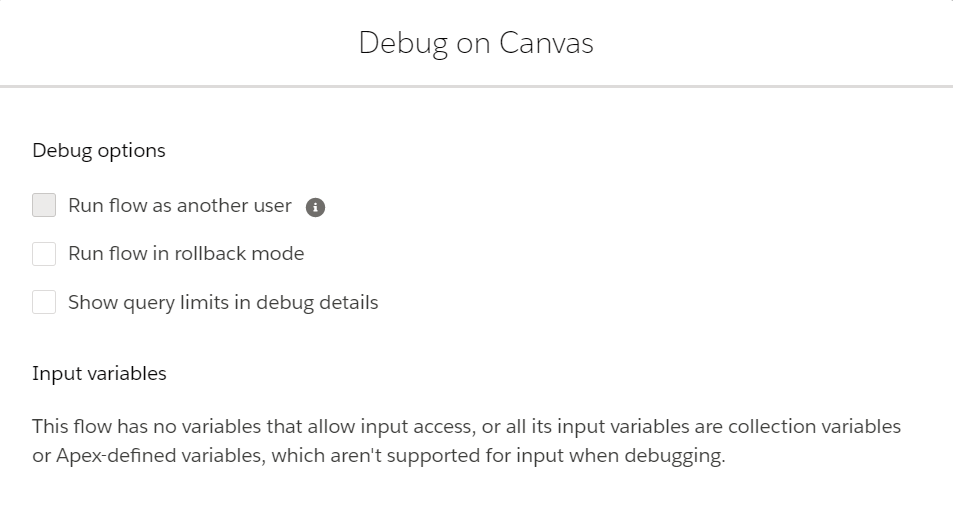
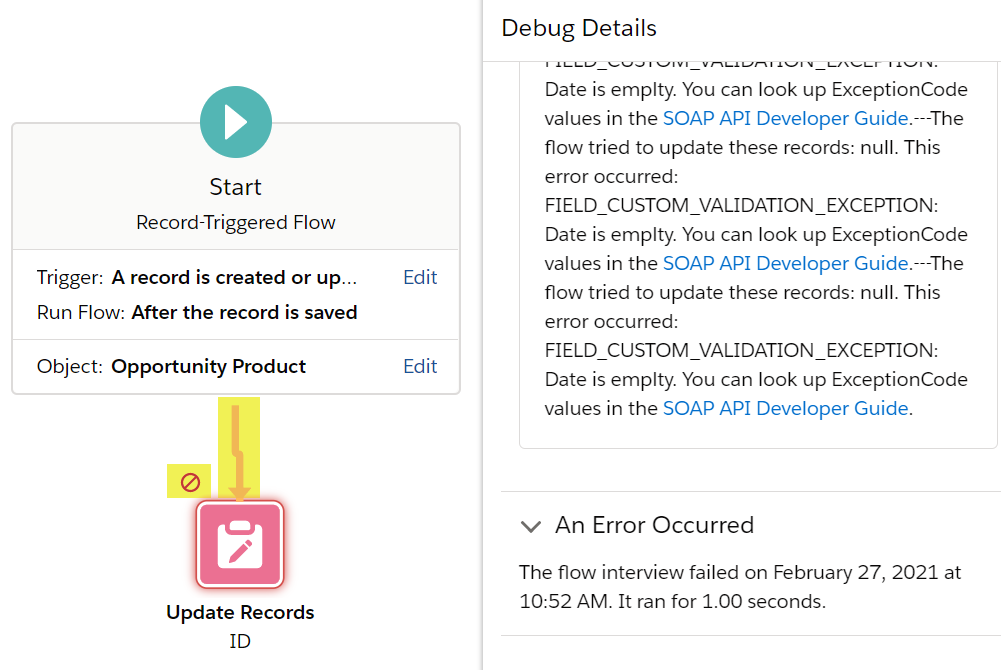
For Autolaunch/Record-Triggered/Scheduled-Triggered flow type, you can debug the flow directly on the canvas. After setting the debug options, you will see the details on the canvas, how the flow is executed (Orange arrow), and where the error shows (Red stop sign).
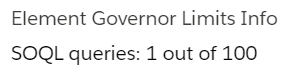
- Run flow in rollback mode: For autolaunch flow (all the flows without screen element), you can choose the debug the flow in rollback mode. Simply put, all the debugs are considered a real run of flows. That means the changes will be saved even though the flow is not activated yet. If you don’t want this to happen, you can choose to run in rollback mode, which will cancel all the changes made by this time of debugging.
— - Show query limits in debug details: This is related to the governor limits for your flow.

3. When Flow Debug Not Available
- Convert the flow to autolaunch flow type:
When you have a record-triggered/platform-even flow type, you cannot debug inside the flow. However, flow is very error-prone so I do not recommend activate the flow without testing. To resolve this, you can actually save it as a new flow and set the type to autolaunch. Then create an input variable so you can do the testing. (Remember to fix the errors after converting the flow.)
- (ADVANCED) Set up debug logs:
Sometimes there is no error and the debug looks fine, but the flow is just not working in the way you want. In this case, you can set up Debug Logs from Setup and see what is happening. This is really advanced so we are not going to cover the details in this article, so leave a comment if you want to see more explanation!
Also a tiny note, you will have to first set up the logs and then execute the flow in order for the details to show up. The logs do not work on any past actions – I got confused by this for a while.
Understand The Structure Of Error Message
1. Error
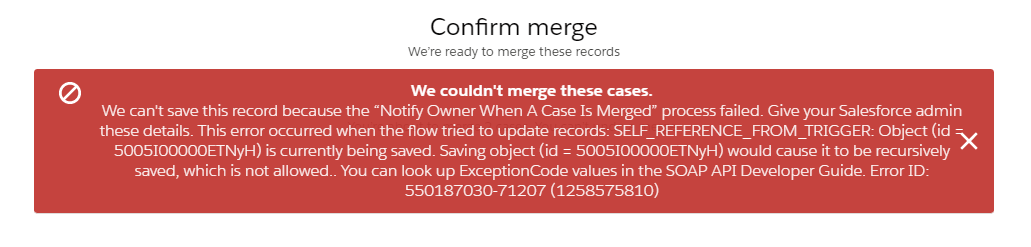
This paragraph is explaining the error that happened. It seems like a long text, but there is usually only one sentence that matters (marked in yellow). The first part of the sentence is the error’s API name, and the second part is additional information. I never searched up on what that error means though as you can actually find some clues which are more than sufficient. For example, you see the word “Validation” inside, and I know “Date is empty” is one of my validation rules. Then it is clear that the flow caused an error because it contradicts my validation rules.

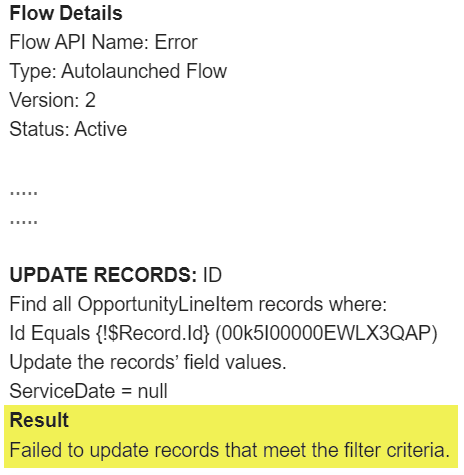
2. Flow Details
Then there is a looooong log of your flow details, which is a second reason why you would just want to close the message. However, not all of the information matters. Sometimes you can even skip them entirely if you have already known what is wrong. Just note that the details always end at the place where the error happened, so you should always read the details backward. If you don’t know why the last step became like this, traced one step back, and so on.
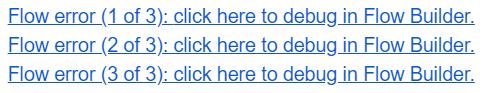
3. Debug In Flow Builder
If you find it too time-consuming to read through the details, after Spring’21 release you can now see the error in the Flow Builder with a click. You will see the sequence of the flow (Orange arrow) and where the error happened (Red stop sign), following by the details on the right.
4. Error ID
This is just an Id given to this specific error. If you really can’t figure out why this error happened, copy this Id and send it to Salesforce support.

Where Do Error Messages Show Up
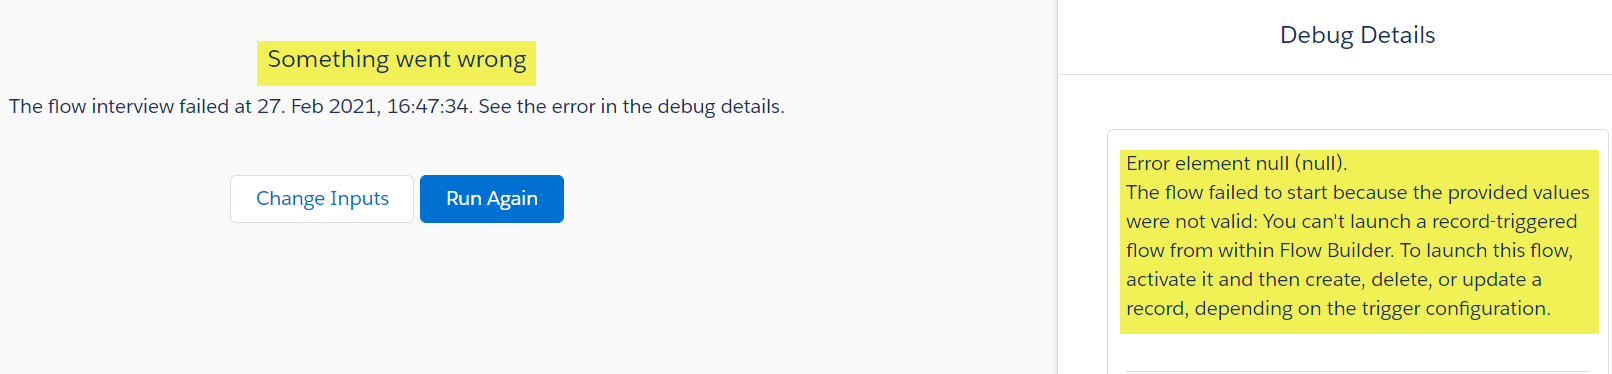
1. Flow Debug Window
If you encountered the error when you are debugging from flow, you will see the “something went wrong” message, and the error will show up on the right.
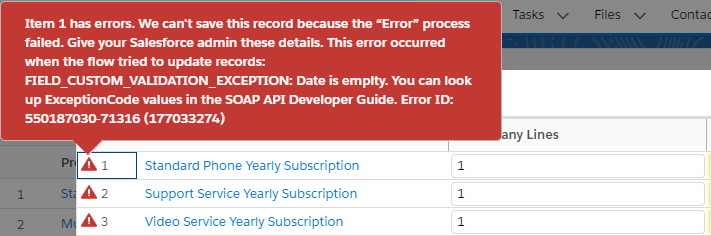
2. Salesforce UI
After the flow is activated and deployed, if a user triggers the flow and an error happens, it will show up in the UI.
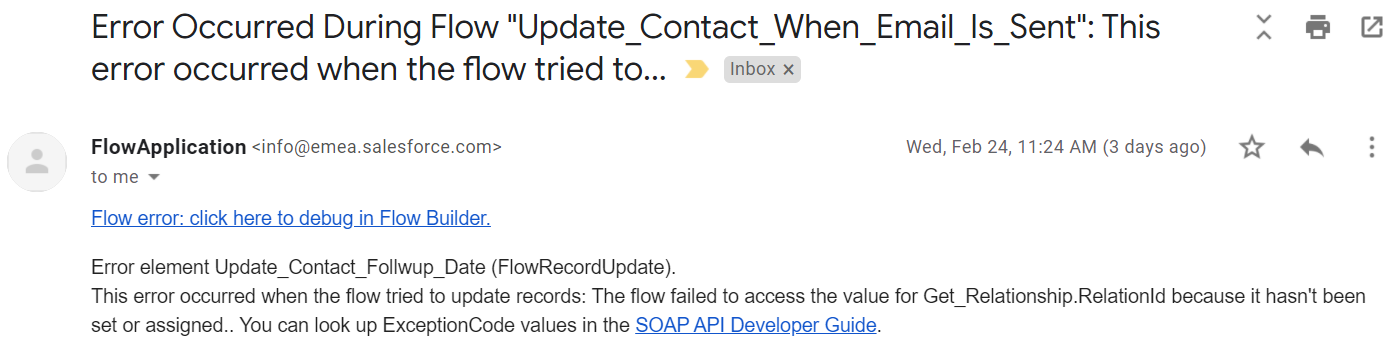
3. Email
No matter how the error happens, there will always be one email copy sent to the person responsible. you can define who should receive the error messages in Setup > Process Automation Setting.

Customize Your Own Error Message
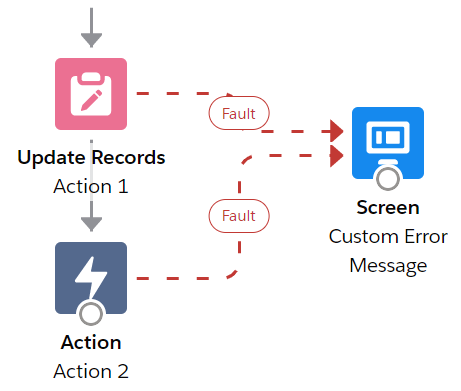
Even though it is not difficult to understand the errors, it will still take some time before you feel super comfortable with it. Also if you have several admins handling flows, the standard error messages might not be friendly to those who didn’t build the flow. In this case, you can consider creating your own error message in flow. For Data (pink ones) and Action elements, you can create a second connector called “Fault Connector”. Basically, you are telling the system: Go with the gray arrows, but if anything goes wrong, go to the red-dotted arrow. Then after the Fault Connector, you can add a Screen element to display your custom message. You can also use an Action element to send out emails, etc.
Annoying as it is, but we still made it! I do hope you won’t see the error message too often, but hey, fixing errors is always the best way to learn right? So don’t be frustrated and let’s overcome this together!
Thanks for the great explanation.
No problem at all Eric. Glad that you find it helpful!
Great information. Very detailed. Thank you.
Thanks for the nice words Pawan!
Very helpful! I have a feeling I’ll be using this a lot!
That’s very nice to hear Cathy, thanks!
Awesome, such clear explanation.
Implemented, and… works like a charm 🙂
Nice to hear that Jaime!:)
Hi Melody,
I sent through an email to your admin email today, regarding an error msg.
Looking forward to your reply.
Thank you.
Hi Shel, no problem. I’ll reply once the previous backlogs have been cleaned up. Stay tuned😊
Just now introducing faults into my flows. Currently working in an Record Trigger After Save and noticed an option in the fault to send an email, which I’ve completed and it works well. I also see “Subflow” launch another flow but when I try to access the SCREEN FLOW I created to display the error back to the user I’m not seeing it. Is this because I’m not able to call a screen flow from the record trigger flow? The option is placed there but not available for use in this case?
Hi Bob, that’s correct – we can’t call a screen flow from record-triggered flow. We can only call autolaunched flow as a subflow.
Hello sir,
it’s been great learning from this article.
But I have one error on my sales app only . It’s not showing on any app .
the error is We can’t launch this flow because of a variable error. Send this error message to your admin. The value null is being provided for variable invitationKey but isn’t compatible with the variable’s data type (String). Check the places where you implemented the flow ‒ such as through a Lightning page or a custom button ‒ and make sure that all provided values are compatible with the variables’ data types.
Hello! So what is the type of the invitationKey and how is it passed into the Flow? It seems like the datatype mismatch is causing the problem
Hi Melody,
I am stuck with this issue for a month now and wondering if you had any feedback. When I click on the Debug link “”Debug the failed interview in Flow Builder for the interview GUID: ” from the flow error email, it takes me to the respective Flow Builder and throws an error
“Something went wrong
We couldn’t find the flow interview. Try again later in case it’s still being processed. If the problem continues, contact Salesforce Customer Support with this message: Flow interview with GUID …… can’t be found. Error ID: -1146007178”
It happens only for one specific flow. Rest of the flows work fine, click on the debug link and it takes to me to the flow builder.
Any idea why this is happening?
Thanks
Anna